Profiling and Tracing
aer offers two ways to understand performance. Use --trace for detailed per-line execution data about each individual test, or --profile for summary sampled data across all tests. Both features are available on test and exec.
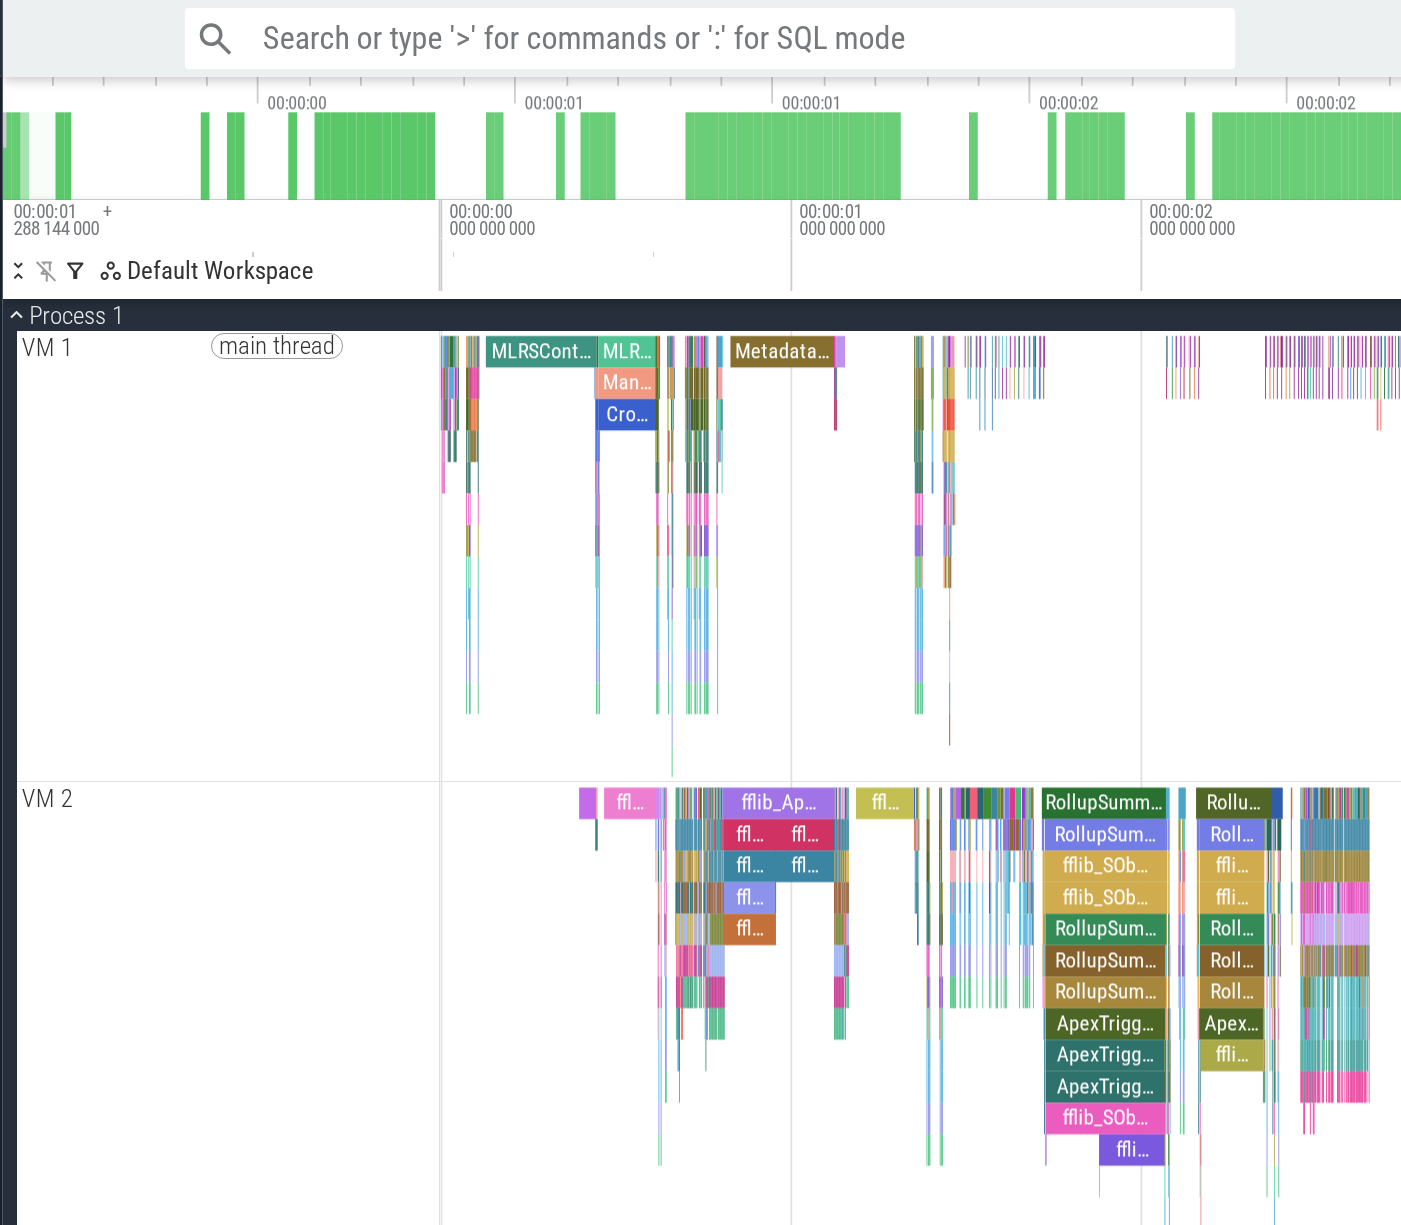
Record execution traces
Add --trace to start the development server and automatically open the execution trace in Perfetto. The trace captures every Apex line and SOQL/DML statement so you can see exactly what happened during execution.
# Run tests and open trace in Perfetto
aer test force-app/main/default --trace

# Execute anonymous Apex and open trace in Perfetto
aer exec --path force-app/main/default \
  "OrderService.reprice();" --trace
To save the trace to a file instead, pass a path:
aer test force-app/main/default \
  --trace=tmp/test.trace

aer exec --path force-app/main/default \
  "OrderService.reprice();" \
  --trace=tmp/exec.trace
Capture CPU profiles
Add --profile to capture a CPU profile and open it in Perfetto when execution completes. The profile samples across all tests to show where Apex time is spent.
# Run tests and open profile in Perfetto
aer test force-app/main/default --profile

# Execute anonymous Apex and open profile in Perfetto
aer exec --path force-app/main/default \
  "OrderService.reprice();" --profile
To save the profile to a file instead, pass a path:
aer test force-app/main/default \
  --profile=tmp/test.pprof

aer exec --path force-app/main/default \
  "OrderService.reprice();" \
  --profile=tmp/exec.pprof
From inside pprof you can generate flame graphs (web), call trees (top), or table views of the hottest functions.